Grafana Cloud offers an awesome free tier for startups. The problem is not documented much. Maybe it’s new for us.
I will ignore registering for part of the Grafana Cloud and think you already have an account.
First step generate config file for alloy.
logging {
  level  = "info"
  format = "logfmt"
}


loki.relabel "journal" {
  forward_to = []

  rule {
    source_labels = ["__journal__systemd_unit"]
    target_label  = "unit"
  }

  rule {
    source_labels = ["__journal__systemd_unit"]
    regex         = ".*\\.service$"
    action        = "keep"
  }

}

loki.source.journal "read"  {
  forward_to    = [loki.write.grafanacloud.receiver]
  relabel_rules = loki.relabel.journal.rules
  labels        = {component = "loki.source.journal"}
  path          = "/run/log/journal"
}


loki.write "grafanacloud" {
  endpoint {
    url = "YOURURL exp https://logs-prod-006.grafana.net/"
    basic_auth {
      username = "grafanaCloudUsername"
      password = "grafanaCloudTokenWithCorrectScopes"
    }
  }
}
Create this file somewhere on your server. Don’t forget to update the username, password, and URL fields
Time to Run Grafana Alloy Container using Podman
podman run --privileged --name alloy -v /run/log/journal:/run/log/journal -v /home/opc/config.alloy:/etc/alloy/config.alloy -p 12345:12345 grafana/alloy:latest run --server.http.listen-addr=0.0.0.0:12345 --storage.path=/var/lib/alloy/data /etc/alloy/config.alloy –privileged added to read config file without any error
/home/opc/config.alloy is my config file location
/run/log/journal is a log file path. Oracle Linux uses this location for journalctl logs.
Since you’re using Oracle Linux, it’s likely that persistent journal logging is not enabled by default, which is why the
/var/log/journaldirectory doesn’t exist. Oracle Linux typically uses volatile journaling (logs are stored in/run/log/journal), which is cleared on reboot.
port 12345 is default alloy port and you can access it with localhost:12345
Also before running it selinux can block your actions. Maybe this code part will help you
sudo chcon -Rt svirt_sandbox_file_t /run/log/journalLets start it and check the logs
podman logs alloy 
Let’s ignore bad request logs. It throws errors due to my previous tests. If there is no error log you can access web UI using
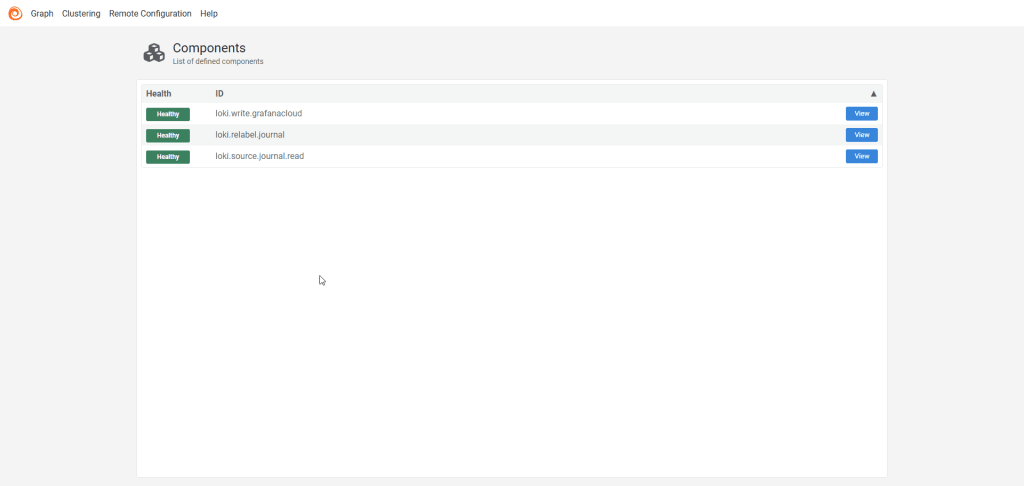
HTTP://serverIP:12345Example Alloy GUI

If everything looks good we can view logs on our grafana cloud. Lets check Grafana and explore Loki data source.

My grafana config is filtered logs for .service units. You need to configure for other use cases
My podman container peridicly runs and I can see the logs of the podman container using this command
journalctl -u nameOfthe.service --output=cat journalctl logs are stored under /run/log/journal on Oracle Linux. So I set the path to “/run/log/journal” . Update it to your needs.
Bir yanıt yazın